Background
The Scientific American suggests that we have been getting taller over the years. Is this true? Let’s dig into some data and find out for ourselves. The purpose of this activity is to demonstrate the ability to combine and make use of data from many sources.
Data Wrangling
# worldwide_height %>%
#   select_if(colSums(!is.na(.)) > 0) %>%
#   mutate(rna = rowSums(!is.na(.))) %>%
#   filter(rna > 2) %>%
#   gather(3:21, key = year, value = height) %>%
#   mutate(year2 = year,
#          year = parse_integer(year)) %>%
#   rename(year_decade = year,
#          country = `Continent, Region, Country`,
#          height.cm = height) %>%
#   separate(year2, into = c("century", "year3"), sep = 2) %>%
#   separate(year3, into = c("decade", "year"), sep = 1) %>%
#   mutate(height.in = height.cm / 2.54) %>%
#   filter(!is.na(height.cm)) %>%
#   select(Code, country, century, decade, year, height.cm, year_decade, height.in)


# worldwide_height

height_xlsx <- worldwide_height %>%
  gather(key = year, value = height, 3:203) %>%
  mutate(year2 = year,
         year = parse_integer(year)) %>%
  rename(year_decade = year,
         country = `Continent, Region, Country`,
         height.cm = height) %>%
  separate(year2, into = c("century", "year3"), sep = 2) %>%
  separate(year3, into = c("decade", "year"), sep = 1) %>%
  mutate(height.in = height.cm / 2.54) %>%
  filter(!is.na(height.cm)) %>%
  select(Code, country, century, decade, year, height.cm, year_decade, height.in) %>%
  na.omit()


# wisconsin

w20 <- wisc %>%
  as_tibble() %>%
  select(DOBY, RT216F, RT216I) %>%
  filter(RT216F > 0,
         RT216I > 0 & RT216I < 12) %>%
  mutate(birth_year = paste0("19",DOBY),
         birth_year = str_pad(birth_year,
                              width = 4,
                              side = "right",
                              pad = "0"),
         birth_year = parse_integer(birth_year),
         birth_year = cut(birth_year,
                          breaks = seq(1909,1999, 10),
                          labels = seq(1910,1990, 10)),
         height.cm = ((RT216F * 12) + RT216I) / .393701,
         height.in = (RT216F * 12) + RT216I,
         study = "winsonsin") %>%
  select(4:7) %>%
  filter(!is.na(birth_year))


# bls

us20 <- bls %>%
  select(height) %>%
  mutate(birth_year = parse_factor("1950", levels = "1950"),
         height.cm = height / .393701,
         study = "bls") %>%
  rename(height.in = height) %>%
  select(birth_year, height.cm, height.in, study)


# ger_con

gcon19 <- ger_con %>%
  select(bdec, height) %>%
  mutate(height.in = height * .393701,
         study = "conscripts19",
         bdec = as.integer(bdec),
         bdec = cut(bdec,
                    breaks = seq(1849,1889, 10),
                    labels = seq(1850,1880, 10))) %>%
  rename(birth_year = bdec,
         height.cm = height)


# ger_pris

gpris19 <- ger_pris %>%
  select(bdec, height) %>%
  mutate(height.in = height * .393700787,
         study = "bavarian19",
         bdec = factor(bdec, levels = c("1850","1860","1870"))) %>%
  rename(birth_year = bdec,
         height.cm = height)

# heights_EW
g18 <- heights_EW %>%
  as_tibble() %>%
  select(GEBJ, CMETER) %>%
  mutate(height.in = CMETER * .393700787,
         study = "b6090",
         GEBJ = as.integer(GEBJ),
         GEBJ = cut(GEBJ,
                    breaks = seq(1719,1779, 10),
                    labels = seq(1720,1770, 10))) %>%
  rename(birth_year = GEBJ,
         height.cm = CMETER)

# combine_all

alld <- bind_rows(gpris19, g18, gcon19, us20, w20)
Data Visualization
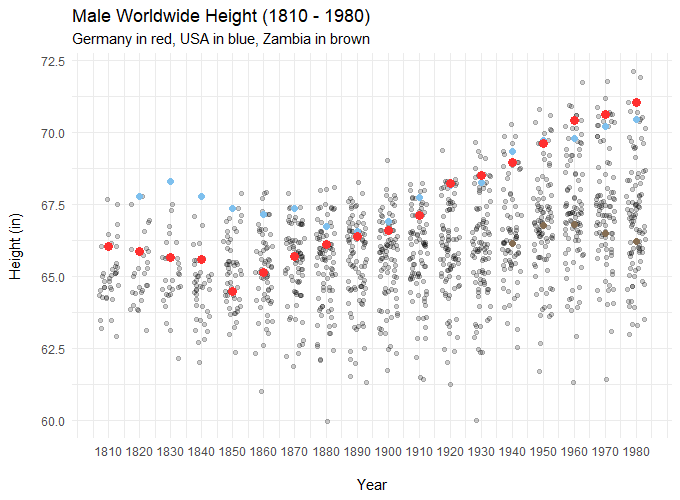
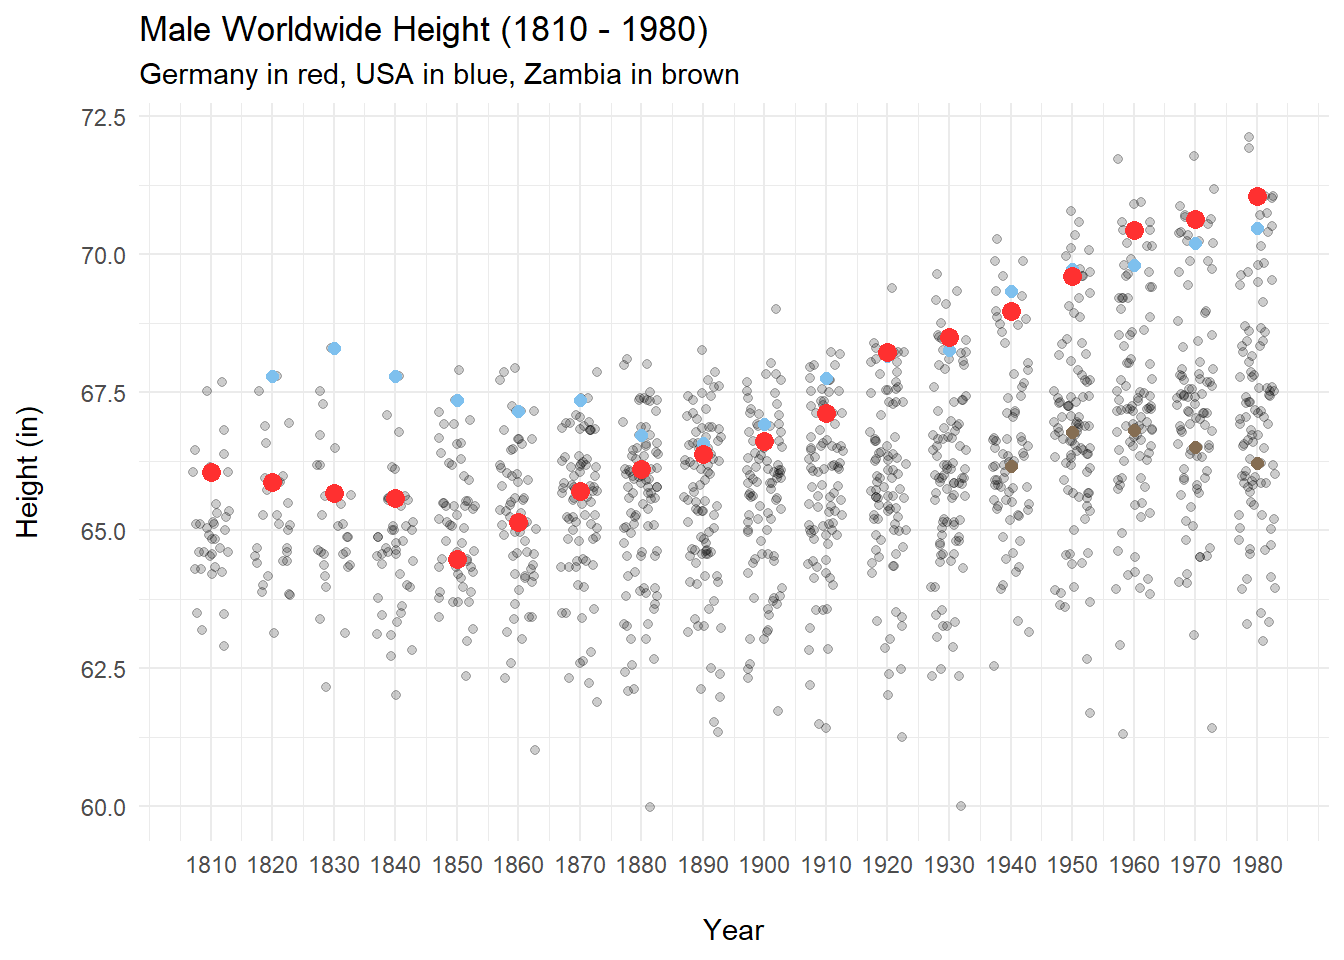
height_xlsx %>%
  ggplot(aes(year_decade, height.in)) +
    geom_jitter(width = 3,
                alpha = .2) +
    geom_point(data = height_xlsx %>%
                 filter(country == "United States of America"),
               aes(year_decade, height.in),
               col = "skyblue2",
               size = 2) +
    geom_point(data = height_xlsx %>%
                 filter(country == "Zambia"),
               aes(year_decade, height.in),
               col = "#856D52",
               size = 2) +
    geom_point(data = height_xlsx %>%
                 filter(country == "Germany"),
               aes(year_decade, height.in),
               col = "firebrick1",
               size = 3) +
    scale_x_continuous(breaks = seq(1810,1980,10)) +
    scale_colour_manual(name = 'the colour',
         values = c('black' = 'black','red' = 'red'), labels = c('c2','c1')) +
    labs(x = "\nYear",
         y = "Height (in)\n",
         title = "Male Worldwide Height (1810 - 1980)",
         subtitle = "Germany in red, USA in blue, Zambia in brown") +
    theme_minimal()
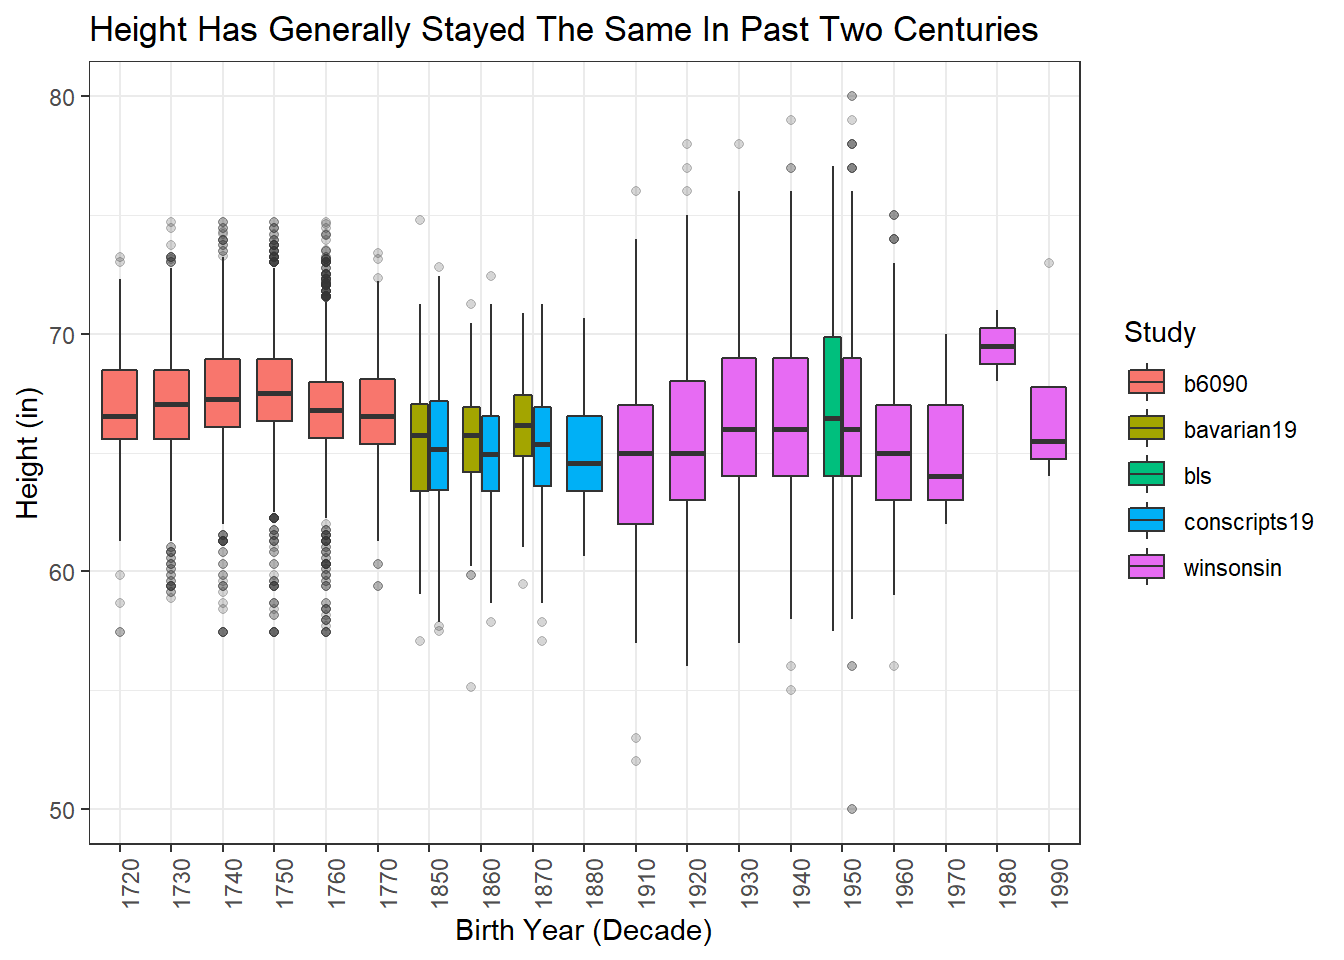
ggplot(alld, aes(birth_year, height.in, fill = study)) +
  geom_boxplot(outlier.alpha = .2) +
  labs(x = "Birth Year (Decade)",
       y = "Height (in)",
       title = "Height Has Generally Stayed The Same In Past Two Centuries",
       fill = "Study") +
  theme_bw() +
  theme(axis.text.x = element_text(angle = 90))
Conclusions
Are humans getting taller over the years? Yes! At least they have in Germany according to the first plot. Ever since 1860, there has been a year after year increase in average height. Other countries seem to be following similar trends. Other data that may complement this finding would be diet patterns.
To answer the same question with other data, 5 separate studies that included height and birth year measures were combined. Right now, the way the data is displayed, it is hard to see a similar trend like Germany. The problem is the data is grouped on the x axis according to study instead of the more readable birth year. The following plot fixes this problem.
With the data arranged along a consistent range of years, we are better able to understand trends. Study groups are still acknowledged with the color legend. In conclusion, it appears we don’t see the same trend as we did with Germany in the first plot. Perhaps height has been the same all along?