obese <- read_csv("prevalence-of-obesity-in-adults-by-region.csv")
Background
Data comes from Our World in Data. Obesity has been a growing problem for many parts of the world. I want to visualize this trend by region, assuming that more wealthier regions are leading the world. Then, I look at how child mortality is effected by education level.
Obesity
obese <- obese %>%
  rename(continent  = Entity,
         year       = Year,
         prevalence = `Prevalence of obesity in adults (18+ years old) (FAO (2017)) (%)`)

label <- obese %>% filter(year == 2014)
ggplot(obese, aes(year, (prevalence)/100, group = continent, col = continent)) +
  geom_point() +
  geom_line() +
  theme_minimal() +
  scale_y_continuous(limits = c(0,.3), labels = scales::percent) +
  geom_label_repel(aes(label = continent), data = label, nudge_x = 1000) +
  theme(legend.position = "none") +
  labs(title = "Prevalence of obesity in adults by region",
       subtitle = "The prevalence of obesity in adults, measured as the percentage of adults aged 18 years and older (both male and \nfemale) with a body-mass index (BMI) greater than 30 kilograms per metre squared.",
       x = "",
       y = "",
       caption = "Source: UN Food and Agricultural Organization/WHO")
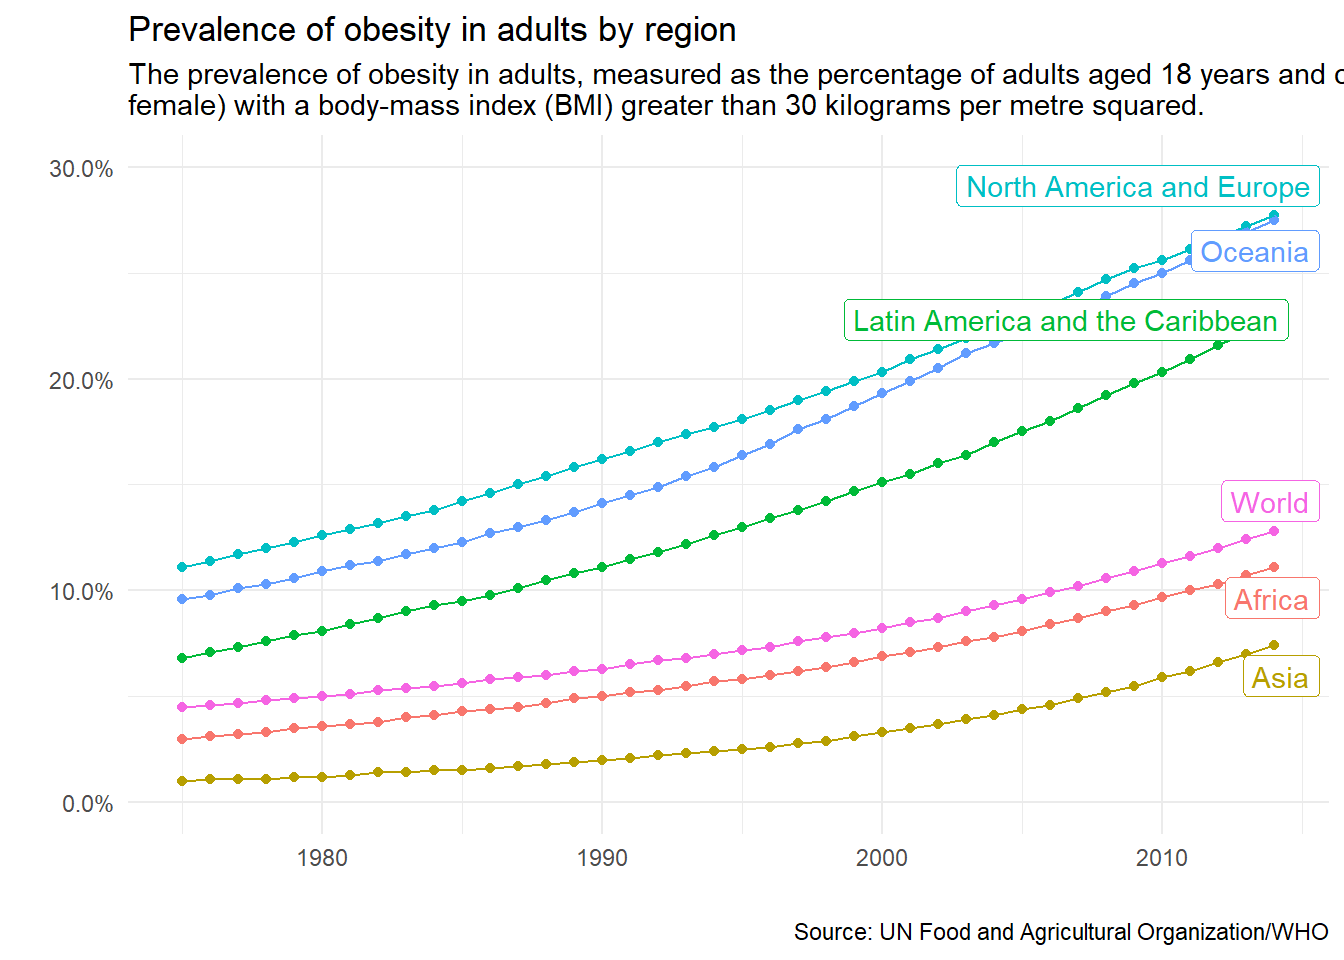
North America and Europe have lead the world in the rise of obesity, closely followed by Oceania. For these continents, obesity rates are approaching a third of their populations. These two countries along with Latin America and the Caribbean are well above the world average obesity rates.
Child Mortality
child_mortality %>%
select(education, child_mort, continent) %>%
na.omit() %>%
mutate(continent = as.factor(continent)) %>%
ggplot(aes(education, log10(child_mort), col = continent)) +
geom_point(alpha = .1) +
geom_smooth(method = "lm", se = F) +
theme_minimal() +
labs(x = "Education (Higher is better)",
y = TeX("$\\log_{10}$(Child Mortality)"),
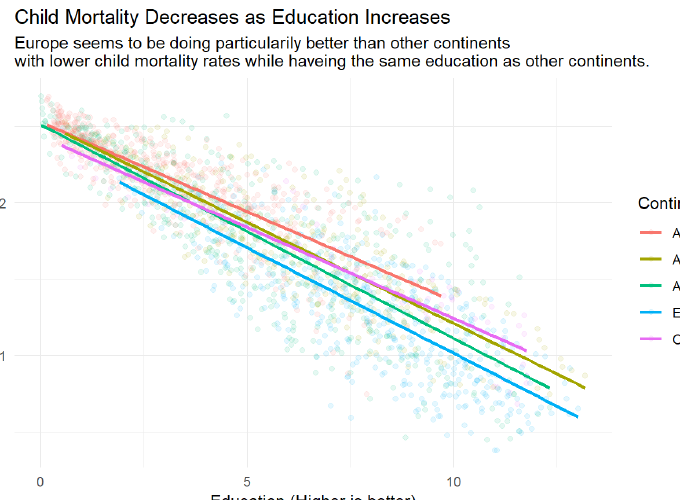
title = "Child Mortality Decreases as Education Increases",
subtitle = "Europe seems to be doing particularily better than other continents \nwith lower child mortality rates while haveing the same education as other continents.",
caption = "\nSource: UN Population Division (2017 Revision)",
col = "Continent")
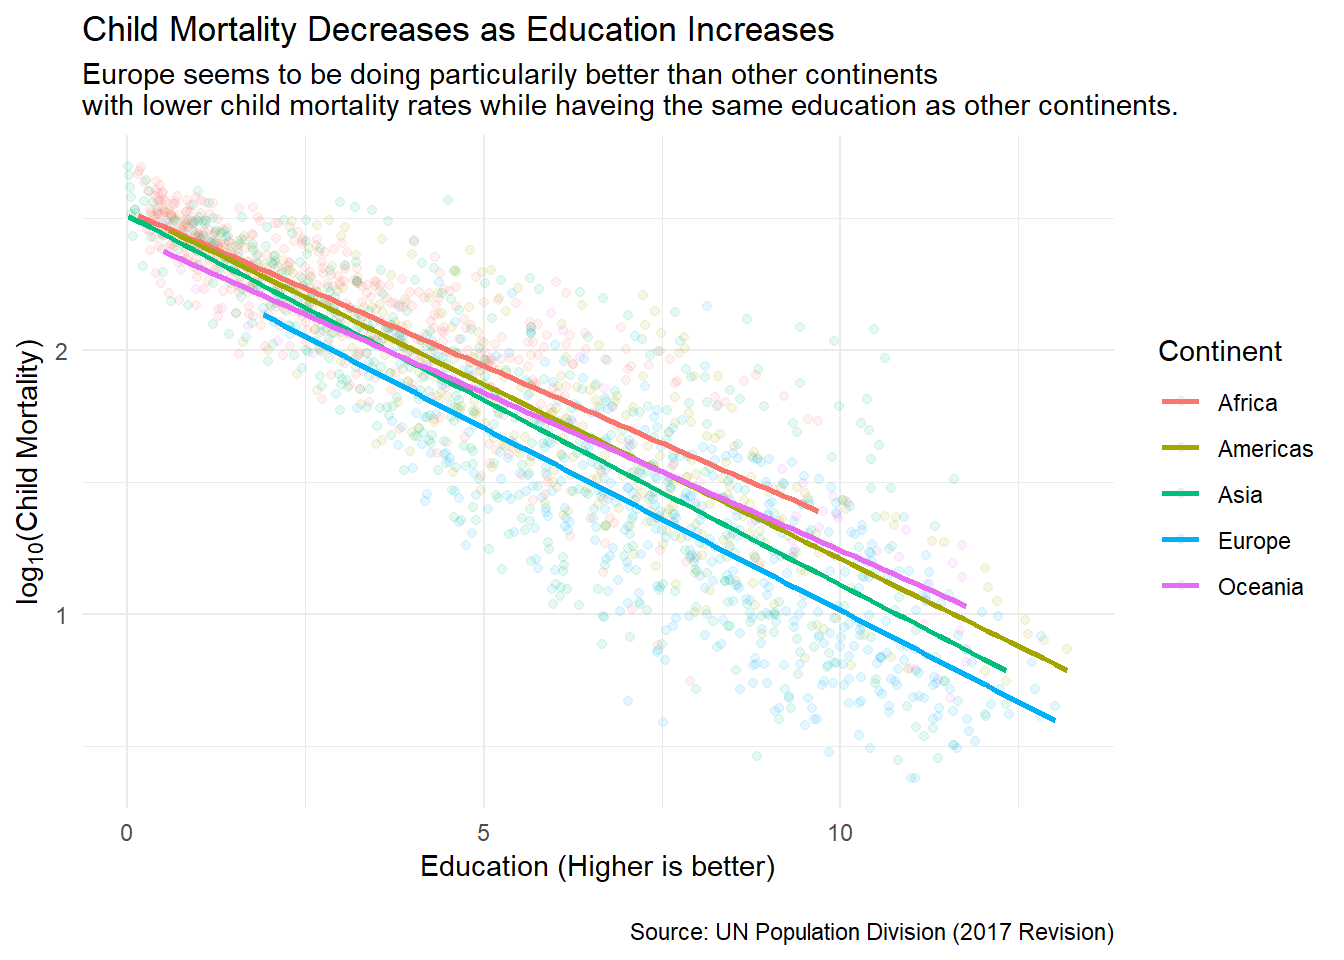
Regressing the log of child mortality on education level grouped by continent, we see something interesting. With the same level of education, Europe seems to be doing better than the other continents in regard to child mortality. We also notice Africa doesn’t have the same opportunity for as much education as the other continents do.