stock_returns_monthly <- c("AAPL","GOOG","NFLX","COST","AMZN","MSFT") %>%
  tq_get(get  = "stock.prices",
         from = "2017-10-01",
         to   = today()) %>%
  group_by(symbol) %>%
  tq_transmute(select     = adjusted,
               mutate_fun = periodReturn,
               period     = "daily",
               col_rename = "Ra")
Background
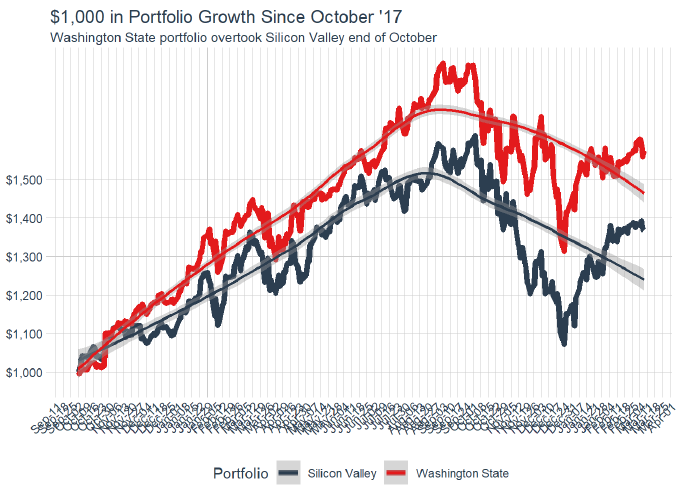
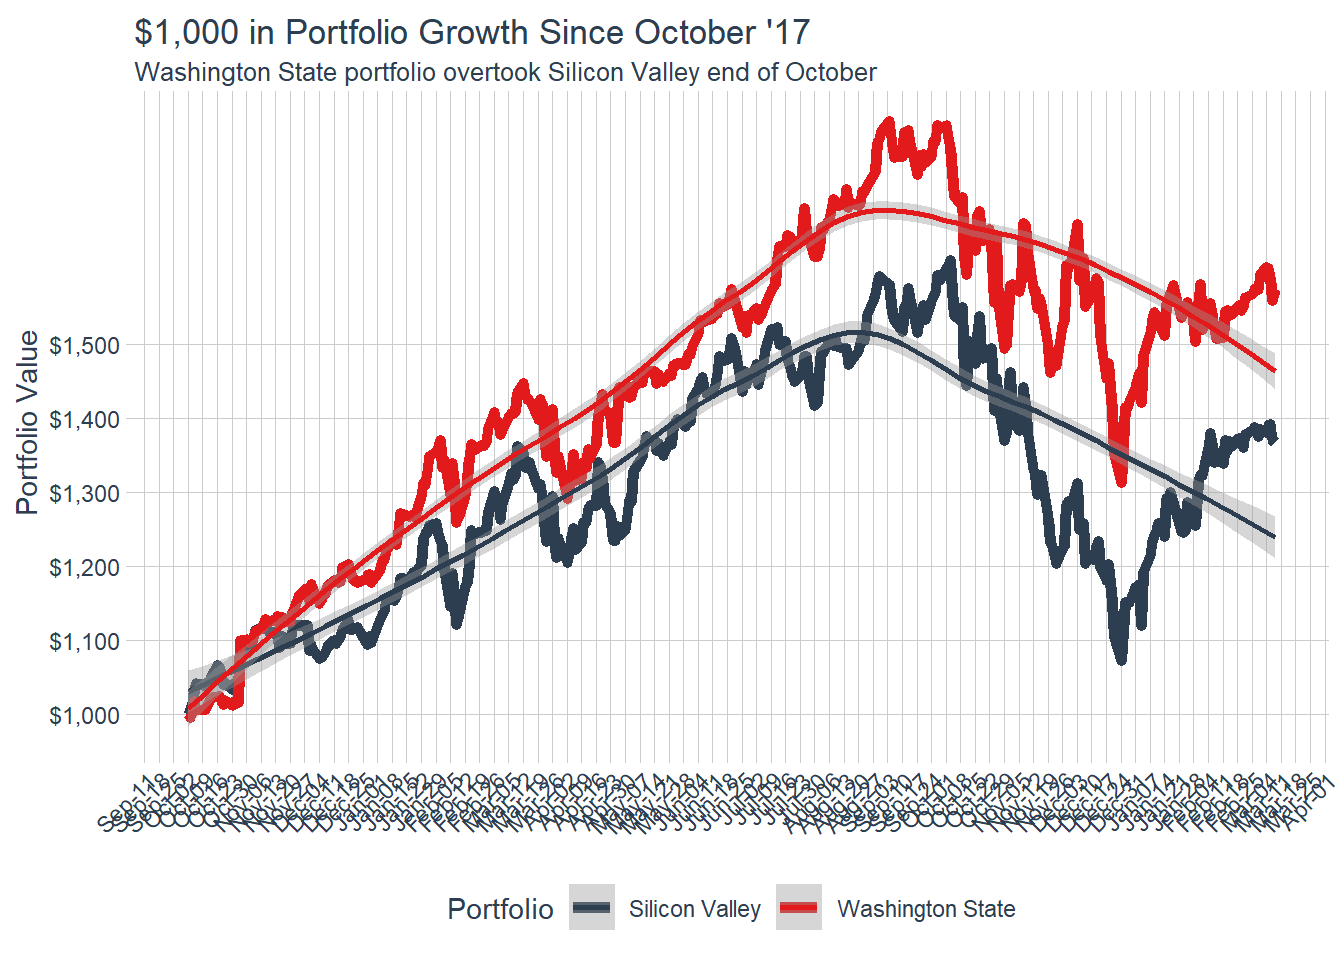
Me and my hypothetical friend want to compare our two different portfolios’. I am interested in the big companies in Washington State while my friend is all about the big tech companies in Silicon Valley. The following portfolio allocations will be put to the test to see which one will earn more money from October 1st, 2017, to today.
Me
- Washington State
- Microsoft 25%
- Amazon 50%
- Costco 25%
Friend
- Silicon Valley
- Apple 50%
- Google 25%
- Netflix 25%
Data Wrangling
stock_returns_monthly_multi <- stock_returns_monthly %>%
  tq_repeat_df(n = 2)


weights <- c(.5, .25, .25, 0, 0, 0,
             0, 0, 0, .25, .5, .25)
stocks <- c("AAPL","GOOG","NFLX","COST","AMZN","MSFT")
weights_table <- tibble(stocks) %>%
  tq_repeat_df(n = 2) %>%
  bind_cols(tibble(weights)) %>%
  group_by(portfolio)


portfolio_growth_monthly_multi <- stock_returns_monthly_multi %>%
  tq_portfolio(assets_col   = symbol,
               returns_col  = Ra,
               weights      = weights_table,
               col_rename   = "investment.growth",
               wealth.index = TRUE) %>%
  mutate(investment.growth  = investment.growth * 1000)
Data Visualization
portfolio_growth_monthly_multi %>% ungroup() %>%
  mutate(portfolio = case_when(
    portfolio == 1 ~ 'Silicon Valley',
    portfolio == 2 ~ 'Washington State')) %>%
  ggplot(aes(date, investment.growth, col = factor(portfolio))) +
  geom_line(size = 2) +
  geom_smooth(method = "loess") +
  scale_color_tq() +
  scale_y_continuous(labels = scales::dollar,
                     breaks = seq(1000,1500, 100)) +
  scale_x_date(date_breaks = "1 week",
               date_labels = "%b-%d") +
  labs(title = "$1,000 in Portfolio Growth Since October '17",
       subtitle = "Washington State portfolio overtook Silicon Valley end of October",
       x = NULL,
       y = "Portfolio Value",
       col = "Portfolio") +
  theme_tq() +
  theme(panel.border = element_blank(),
        axis.text.x  = element_text(angle = 45,hjust = 1),
        panel.grid.minor.y = element_blank())
Conclusions
Despite all the attention the companies in Silicon Valley get, my investments in the big companies of Washington State took the lead at the end of October last year and maintained a consistent lead.